Satellite images of Earth help us predict poverty better than ever
The newest way to accurately predict poverty comes from satellite images and machine learning. This imaging technique could make it easier for aid organizations to know where and how to spend their money; it may also help governments develop better policy.
We already know that the more lit up an area is at night, the richer and more developed it is. Researchers use this method to estimate poverty in places where we don’t have exact data. But “night light” estimates are rough and don’t tell us much about the wealth differences of the very poor. Scientists at Stanford University fed a computer three data sources — night light images, daytime images, and actual survey data — to build an algorithm that predicts how rich or poor any given area is. This method, described in a study published today in the journal Science, estimates poverty in more detail than we’ve had before.
DAYTIME IMAGERY CREATES A FULLER PICTURE
It’s hard to measure poverty in the developing world. The best way is by looking at economic data — like household wealth and assets — collected through household surveys. Problem is, we don’t have these surveys for much of the world because they’re expensive, according to study co-author Neal Jean, a doctoral candidate studying machine learning at Stanford. “The idea is that if we train our models right, they help us predict poverty in areas where we don’t have the surveys,” he says, “which will help out aid orgs that are working on this issue.”
Using night lights to predict poverty provides important information about the economic growth of different countries, says Simon Franklin, an economics researcher at the London School of Economics who was not involved with the study. But they don’t show detailed levels of poverty within a country.
They don’t tell us whether a place is rural and densely populated, or wealthy and sparsely populated. A village near a lake and a village near a forest could both show up as having zero lights at night. But the two have access to different natural resources, and this affects how wealthy they are. “In Africa, a lot of these places that are the most poor are actually just uniformly dark at night,” says Jean. “So if you use nighttime lights only to try to find these people, since there’s no variation in nighttime lights you can’t predict any variation in poverty.” Daytime imagery creates a fuller picture.
Building the algorithm took a two-step process called “transfer learning.” First, researchers showed a neural network daytime and nighttime images of five African countries: Uganda, Tanzania, Nigeria, Malawi, and Rwanda. Using deep learning techniques, they taught it to predict where night lights would be by looking at the daytime images and searching for correlations. The model learned, for example, that if there are a lot of houses in one area, the same area probably has a lot of light at night. If an area only has dirt, it probably won’t.
By teaching computers which daytime features translate to night light, researchers can make better predictions about which places are poor. Because areas like lakes are expected to be dark at night, dark readings from them can be discarded; but readings of darkness from roads and villages can be more closely targeted by researchers and governments trying to help poor communities.
For the second step, researchers used a different model called a ridge regression model. This model already knows the connection between land features and lights. Scientists then gave it one more set of information: actual survey data from the Demographic Health Services and World Bank Living Standards Measurement Study.
THE MODEL IS LESS USEFUL FOR MEASURING POVERTY WITHIN A CITY
This time the algorithm didn’t just learn that 10 houses in a village usually means there is a certain amount of light. By cross-checking with survey data, it saw that for example, these 10 houses have a household income of $1.90 a day. Now, if we see 10 similar houses in a nearby area where there’s no survey data, chances are that it has similar wealth.
So why not skip the first step and directly teach the algorithm to predict poverty from daytime images and surveys? The deep learning approach in the first step only works if you have a lot of data. We have all the daytime and nighttime images, so it’s easy to teach the computer to make those connections. But there isn’t much survey data, so using deep learning to connect daytime images and poverty information wouldn’t create a very accurate algorithm. Teaching the model to look at nighttime data first and then survey data gives us more information to fine-tune the algorithm.
Imagine that you’re trying to teach an algorithm to recognize a picture of a cat. If you show it two pictures of cats and one picture of a bird, it might later identify a dog as a cat because they’re about the same size and both furry with four legs. If you show it thousands of pictures of cats and thousands of pictures of different things that are not cats, it will be much better at distinguishing what is a cat and what isn’t. This is, essentially, what the researchers did with their satellite data.
THE NEXT STEP IS TRAINING IT TO WORK ON OTHER COUNTRIES AND BETTER MAP POVERTY ACROSS THE WORLD
To better explain this “transfer learning” process, Jean uses an analogy from the movie Cool Runnings. “The movie is about a Jamaican team that wants to compete in the bobsled event, but they don’t have ice, so they train for the Olympics by practicing on a dirt hill,” he says. “Dirt isn’t the same, but they learn transferable skills that they can apply to the actual task, which is competing on ice in a real bobsled.”
Transfer learning is the most accurate way of predicting average household consumption and wealth of villages. Crucially, it beats the night lights model alone by anywhere from 81 to 99 percent of the time depending on the specific trial.
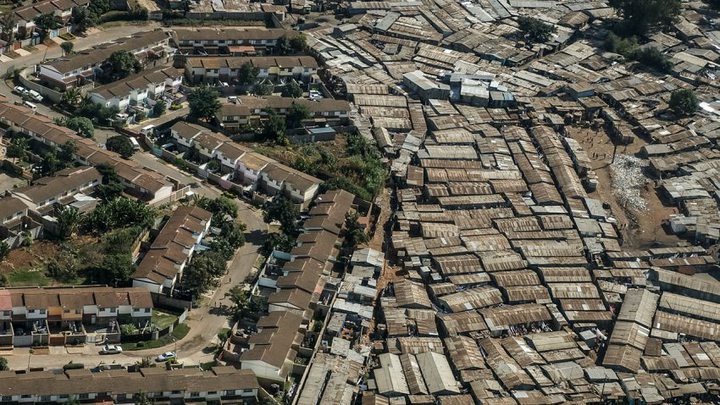
But there are limitations to the method, says Franklin. First he says it’s good for looking at differences in poverty between rural and urban areas, and less useful for measuring poverty within a city. There are very rich areas and very poor areas within any given city, but it’s harder to tell the difference in urban areas by using daytime imagery alone. Alexei Abrahams, an economist at the University of California-San Diego, pointed out that the current study uses an old series of night light images. Since 2012, NASA has been recording night lights with a new and more accurate satellite, so further studies should use the better data.
Another limitation that Jean points out is that the network has been trained specifically to look at five African countries. This means the particular model would probably be far less accurate if tasked with predicting poverty in India or China. But this method is cheap and easy to scale, since all the images were from the public domain, so the next step is training it to work on other countries and better map poverty across the world.